


|
|
|
|
After the app has been started, it enters into Groups selection screen:
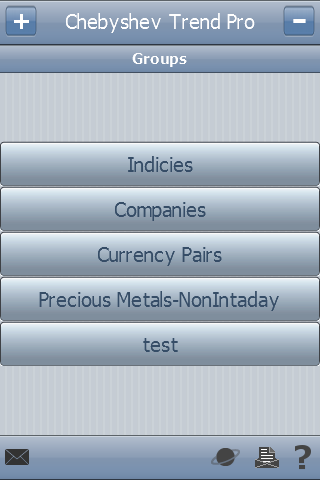
User can add new group there by pressing  button or delete group by pressing
  button or enter into existing group by pressing one of Groups buttons.
Bottom toolbar icons mean:
-  - feedback by e-mail;
-  - Market Scanner web app link (beta version);
-  - groups/symbols lists export to email;
-  - help page with app description and that manual access.
Inside group user gets acces to symbols (i.e. indicies, currency pairs, other financial instruments):
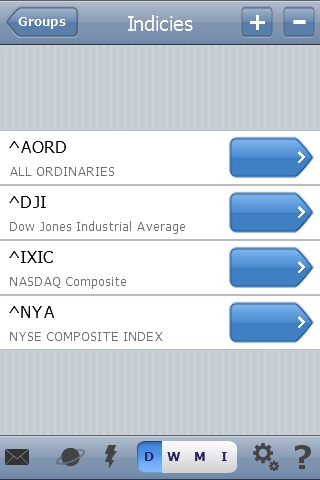
He can add new symbols ( button) by search in Yahoo finance listed symbols. Yahoo driven suggest system (Google driven for Google Edition users) allows to search not only by symbol's name but by it's description substring also.
There are some new icons on the bottom toolbar:
-  - Daily/Weekly/Monthly/Intraday (15 minutes bars currently) time frames selection. Attention to Google Edition users: as soon as it fully oriented on intraday bars the selector looks like
 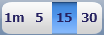 Abbreviations mean 1, 5, 15, 30 minutes
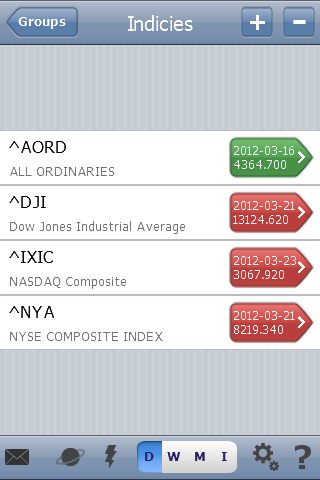
-  - By pressing zap user starts data retrieving & recent signals' counting against the current group. After process completion big blue buttons on the right of symbols' buttons should change color to red or green depending on signal's direction and show signal's time for intraday or date for other and value on what signal was occured:
 |
 |
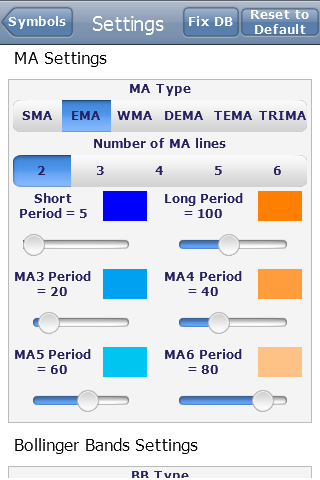
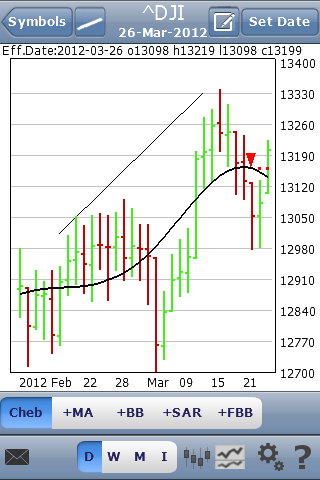
 - indicators settings. By pressing it user will enter into first Settings screen. It allows to tune common app settings & both ChebyshevTrend & supersignal (if purchased) settings. Pressing 3 points (Next) button user can enter into the second Settings screen. It allows to tune settings for Chebyshev Trend, MA, Bollinger Bands, Parabolic SAR, MACD, Chaikin ndicators & oscillators:
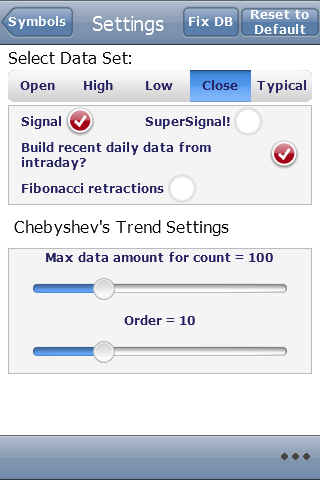 |
 |
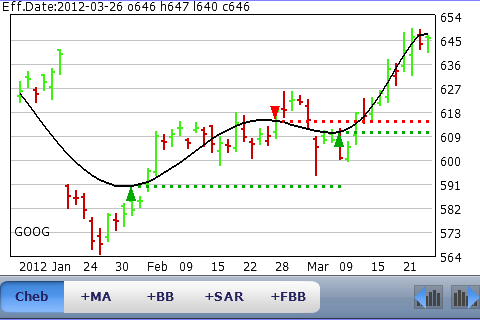
 - shows standard line edit dialog to add/edit symbol comment;
 - allows to add custom lines to chart & keep in memory:
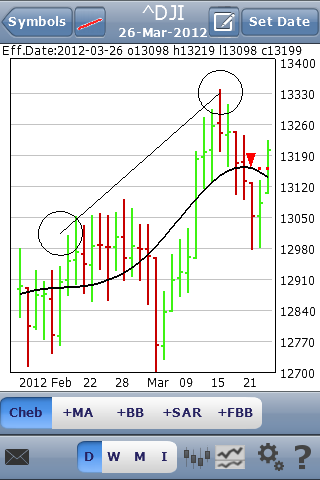 |
 |
 - to turn charts to candles view from ohlc view and it's changed to
  if so.
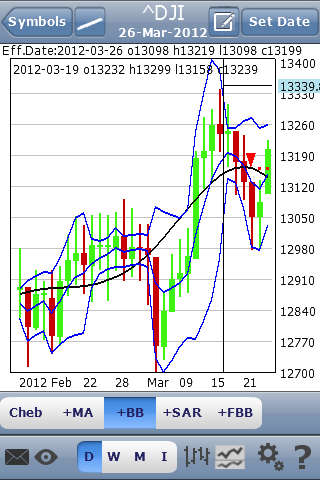
 - allows to turn charts into 2-charts mode:
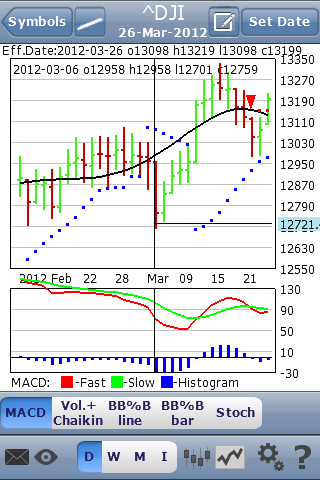
 is appeared when user moves chart crosshair by finger. Pressing it allows to select current crosshaired date as a chart end date.
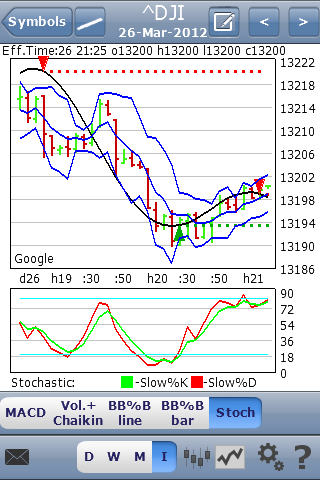
SuperSignal is developed at last!
A lot of us searched how to improve the app signals quality but most succesfull inventor is Alon Hadar!
And there is a method description as he explains it:
the key is to use only the signals that are paralleled to price touching lower order channels
in the direction of the channels trend only
long = channels are up + price near channel's bottom + chebyshev signal buy
short = channels are heading down + price near channel's upper line + chebychev signal sell
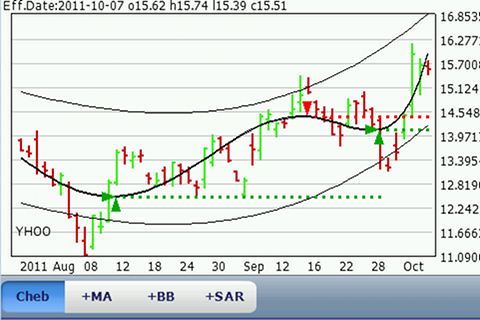
Put attantion that there are 2 variables for the channel that can change ther results - the most important is the polynom order - default is 4
but in some cases the 3/5/6 show better results. The trader should "play" with the channel order to find the channel
that is most reliable meaning that price touch the bands and reverse as much as possible.
The second variable is the standard deviation which default is 2 like bollinger
but in some cases when the security is very volatile you can increase the s.d. to get better results.
The last tip is:
Traders should trade only the signals that are in the direction of the last signal in the higher frame meaning -
if in weekly frame last signal is long they should take all long signals on daily frame and avoid all short signals;
if in weekly frame last signal is short they should take all short signals on daily frame and avoid all long signals.
Also Marcello Djunaidy offers to use Supersignal as an envelope for overbought/oversold indication: buy when below envelope, sell when above envelope
About BB%B oscillator:
Thanks TayJT who offered to implement it. He provided the formula as it was developed by Tradestation members:
BB%B = 100 * ( Price - LowerBand ) / ( UpperBand - LowerBand ) ;
Ken Burkhalter modified it to scale chart from 100/0/-100:
BB%B = 100 * ((Price-LowBand) - (HighBand - LowBand)/2) / ((HighBand-LowBand)/2);
This would more clearly show the deviation of a price from mean value.
More info about Fibonacci Bollinger Bands there:
Fibonacci Bollinger Bands
Good luck!